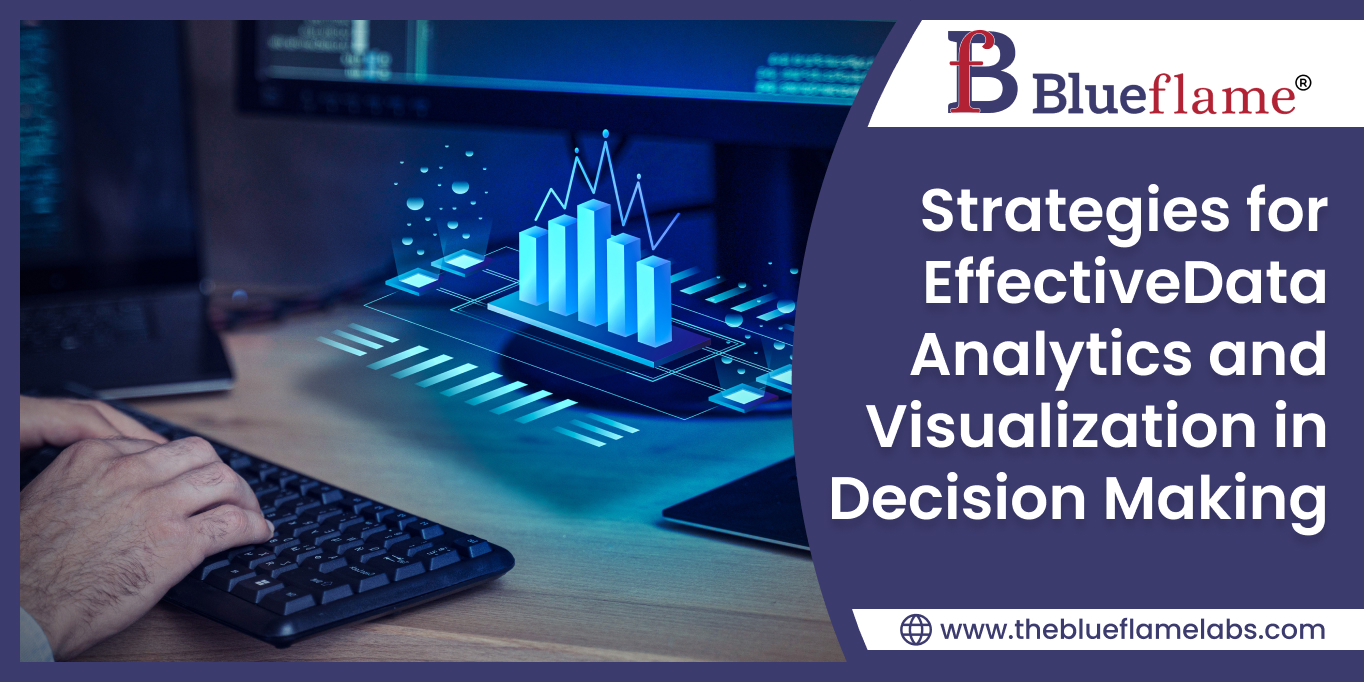
Data analytics and visualization are pivotal tools that empower companies to sift through vast datasets, unveiling insights that drive informed, strategic decisions. It's all about turning raw data into a clear picture of what's happening and forecasting what's next. As businesses grapple with more complex data than ever, the ability to not just analyze but also effectively visualize data stands as a cornerstone of competitive advantage.
Enter Blueflame Labs, a beacon for B2B businesses and IT professionals seeking to elevate their decision-making processes. With a suite of advanced data analytics and visualization tools, Blueflame Labs doesn't just offer software; it offers a roadmap to clarity. By harnessing these powerful strategies, businesses can unlock insights faster, communicate findings more effectively, and ultimately, navigate the complexities of the modern market with greater agility. Blueflame Labs is not just facilitating data analysis; it's empowering businesses to make smarter, data-driven decisions that pave the way for success.
Harnessing Data Analytics for Insightful Business Strategies - The Path to Enhanced Efficiency and Competitiveness
Data is as valuable as currency in the present-day scenario making the significance of data analytics in decision making is monumental. By applying data analytics strategies, businesses transform overwhelming volumes of raw data into actionable insights. This process is crucial, as it enables organizations to identify patterns, trends, and correlations that might otherwise remain hidden within the complexity of big data. The power of these insights lies in their ability to inform strategic decisions, leading to optimized operations and a solid competitive edge.
Data-driven decision making, fuelled by analytics tools and technologies, is reshaping the landscape of business intelligence. By leveraging Blueflame Labs data solutions, businesses can tap into the full potential of predictive analytics implementation and visualization techniques. These advanced methodologies not only enhance the understanding of current performance but also forecast future trends with remarkable accuracy.
The transition to a data-driven model is not just about adopting new technologies; it's about a cultural shift towards valuing data at every level of the organization. Companies that succeed in embedding data analytics into their decision-making processes witness profound improvements in efficiency and business outcomes. From streamlining operations to tailoring customer experiences, the benefits are multifaceted.
Furthermore, data visualization best practices play a pivotal role in translating complex data sets into intuitive, graphical representations, making insights accessible to all stakeholders. By enhancing business intelligence through strategic use of data, organizations pave the way for innovative solutions and sustainable growth.
Leveraging Analytics to Forge Data-Driven Pathways - A Comprehensive Approach to Business Intelligence
In the quest for data-driven excellence, the strategic deployment of data analytics strategies stands as a fundamental pillar. The initial step involves defining clear objectives. Knowing what you aim to achieve with data analytics sets the stage for all subsequent efforts. This clarity ensures that the analytics tools and technologies employed are aligned with specific business goals, thereby enhancing decision-making processes.
Ensuring data quality is another critical strategy. The adage "garbage in, garbage out" holds particularly true in the realm of data analytics. High-quality data is the foundation upon which reliable insights are built. As such, businesses must establish rigorous data management practices to cleanse, validate, and standardize their data.
Employing the right analytics tools is equally vital. With the plethora of analytics tools available, selecting those that best fit the organization's needs can significantly amplify the effectiveness of data analytics. Blueflame Labs data solutions, for instance, offer a range of tools designed to cater to diverse analytics requirements, from visualization techniques to predictive analytics implementation.
Integration of predictive analytics and big data technologies marks the frontier of strategic data analytics. These forward-looking insights enable businesses to not only understand past and present trends but also to anticipate future developments. By employing predictive models and analysing big data insights, companies can uncover opportunities for innovation and growth, thereby securing a competitive advantage.
Incorporating these strategic approaches into the analytics framework fosters a culture of data-driven decision making. Through careful planning, quality control, and the judicious use of advanced analytics technologies, businesses can enhance their intelligence capabilities and achieve superior data-driven outcomes.
Transforming Data into Visual Stories - A Guide to Clarity and Actionable Insights in Business Decision Making
The data analytics world is highly complex necessitating visualization techniques to serve as a bridge between raw data and actionable insights. The significance of data visualization lies in its ability to make intricate datasets not just comprehensible but also engaging. By translating numbers into visual stories, businesses can more easily identify trends, patterns, and outliers that might go unnoticed in traditional spreadsheets.
Various visualization tools and techniques play a crucial role in this interpretative process. From simple bar charts to intricate heat maps and interactive dashboards, the choice of visualization depends on the nature of the data and the insights sought. Blueflame Labs data solutions stand at the forefront of this visual revolution, offering a suite of tools that embrace data visualization best practices. These tools empower users to customize their analytical views, making it easier to digest complex information and make informed decisions swiftly.
The integration of visualization into data analytics strategies enhances business intelligence by providing a clear, visual context. This not only aids in understanding the current state of affairs but also in predicting future trends through predictive analytics implementation. By leveraging big data insights through compelling visual narratives, businesses can communicate findings more effectively, driving data-driven outcomes across all levels of the organization.
Effective data visualization acts as a catalyst for enhanced decision-making. It simplifies the complexity of data, allowing businesses to focus on strategic actions based on solid, visualized evidence. Through the adoption of visualization techniques and tools, companies can unlock the full potential of their data, leading to more innovative and insightful business practices.
Empowering Online Businesses - How Blueflame Labs Drives Growth Through Data Analytics and Visualization
Blueflame Labs has carved a niche in revolutionizing e-commerce through the strategic implementation of data analytics and visualization strategies. By equipping online retailers with advanced analytics tools and technologies, Blueflame Labs enables businesses to unearth big data insights, enhancing their decision-making process and ultimately boosting sales and customer satisfaction.
One notable example is how Blueflame Labs assisted a burgeoning e-commerce platform in optimizing its product recommendations. By employing predictive analytics implementation, the platform was able to analyze customer behavior patterns, leading to personalized shopping experiences and increased conversion rates. This approach not only solidified customer loyalty but also positioned the company ahead of its competitors in a saturated market.
Another case study involves leveraging data visualization best practices to overhaul an online retailer's inventory management system. Through intuitive dashboards, the retailer gained real-time visibility into stock levels, demand forecasts, and supply chain bottlenecks. This insight allowed for more efficient operations and reduced overhead costs, showcasing the tangible benefits of data-driven business outcomes.
These examples underscore Blueflame Labs' commitment to enhancing business intelligence in the e-commerce sector. By harnessing the power of data analytics strategies and visualization techniques, Blueflame Labs data solutions empower businesses to navigate the complexities of the digital marketplace with confidence and precision.

Mastering Data Preparation with Salesforce CRM Analytics Recipes
Read More
Rootstock Order Management
Read More
Enhancing E-commerce Experiences through Advanced Cloud Solutions
Read More
Leveraging Oracle NetSuite for Scalable and Integrated Business Management
Read More
The Future of Business with AI and Machine Learning in CRM Solutions
Read More
Innovations in Salesforce Implementation through Maximizing Customer Engagement and Operational Efficiency
Read More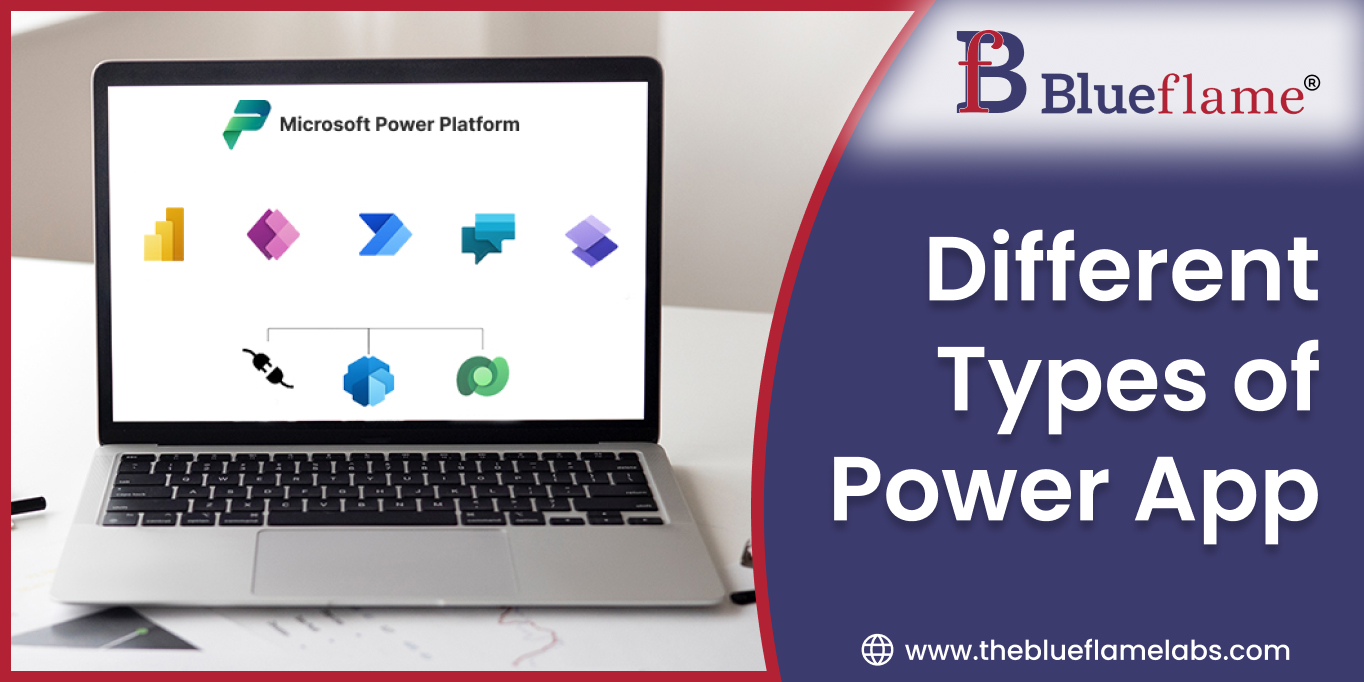
Different Types of Power Apps
Read More
JavaScript Features You Must Know
Read MoreWhen you visit any website, it may store or retrieve information on your browser, mostly in the form of cookies. This information might be about you, your preferences or your device and is mostly used to make the site work as you expect it to. The information does not usually directly identify you, but it can give you a more personalized web experience. Because we respect your right to privacy, you can choose not to allow some types of cookies. Click on the different category headings to find out more and change our default settings. However, blocking some types of cookies may impact your experience of the site and the services we are able to offer.
These cookies are necessary for the website to function and cannot be switched off in our systems. They are usually only set in response to actions made by you which amount to a request for services, such as setting your privacy preferences, logging in or filling in forms. You can set your browser to block or alert you about these cookies, but some parts of the site will not then work. These cookies do not store any personally identifiable information.
These cookies enable the website to provide enhanced functionality and personalisation. They may be set by us or by third party providers whose services we have added to our pages. If you do not allow these cookies then some or all of these services may not function properly.
These cookies allow us to count visits and traffic sources so we can measure and improve the performance of our site. They help us to know which pages are the most and least popular and see how visitors move around the site. All information these cookies collect is aggregated and therefore anonymous. If you do not allow these cookies we will not know when you have visited our site, and will not be able to monitor its performance.
These cookies may be set through our site by our advertising partners. They may be used by those companies to build a profile of your interests and show you relevant adverts on other sites. They do not store directly personal information, but are based on uniquely identifying your browser and internet device. If you do not allow these cookies, you will experience less targeted advertising.

 Strictly Necessary Cookies